
The West Virginia Mountaineers, pictured above in the cover photo, played in three overtime games last season. They offer the perfect lead-in to a statistical survey of college football overtime games since the 2003 regular season. You’ll also find statistical compilations of scoring margins.
Part one of this look at college football since 2003, focusing on comebacks, home teams, and late-game tiebreaking scores, can be found here.
As was the case with part one, freelance researchers Aaron Calhoun and Ryan Orlinski contributed to this piece, gathering and fact-checking stats from 2003 through 2012. I researched the 2013 season. A total of 107 box scores, 68 of them from 2003, could not be located for this study. Overtime results were tracked for these games and their results, but scoring sequences were not. This affects (albeit to a very small degree) the specific statistic pertaining to whether teams with the ball second in an overtime stanza won or lost.
We’ll begin with scoring margins before getting to the overtime tabulations.
*
SCORING MARGINS BY YEAR, 2003-2013
2003:
Games with final margins of 60 points or more: 5
50 to 59: 9
40 to 49: 37
30 to 39: 82
20 to 29: 140
10 to 19: 174
1 to 9: 224
*
2004:
60/more: 5
50 to 59: 14
40 to 49: 24
30 to 39: 81
20 to 29: 121
10 to 19: 153
1 to 9: 232
*
2005:
60/more: 5
50 to 59: 14
40 to 49: 22
30 to 39: 78
20 to 29: 136
10 to 19: 139
1 to 9: 242
*
2006:
60/more: 4
50 to 59: 8
40 to 49: 37
30 to 39: 75
20 to 29: 124
10 to 19: 195
1 to 9: 236
*
2007:
60/more: 1
50 to 59: 12
40 to 49: 28
30 to 39: 71
20 to 29: 120
10 to 19: 187
1 to 9: 260
*
2008:
60/more: 4
50 to 59: 13
40 to 49: 35
30 to 39: 85
20 to 29: 133
10 to 19: 152
1 to 9: 261
*
2009:
60/more: 1
50 to 59: 11
40 to 49: 25
30 to 39: 64
20 to 29: 131
10 to 19: 184
1 to 9: 264
*
2010:
60/more: 3
50 to 59: 8
40 to 49: 43
30 to 39: 79
20 to 29: 142
10 to 19: 160
1 to 9: 248
*
2011:
60/more: 1
50 to 59: 15
40 to 49: 40
30 to 39: 66
20 to 29: 144
10 to 19: 159
1 to 9: 255
*
2012:
60/more: 1
50 to 59: 6
40 to 49: 42
30 to 39: 83
20 to 29: 130
10 to 19: 162
1 to 9: 273
*
2013:
60/more: 3
50 to 59: 15
40 to 49: 41
30 to 39: 89
20 to 29: 144
10 to 19: 184
1 to 9: 223
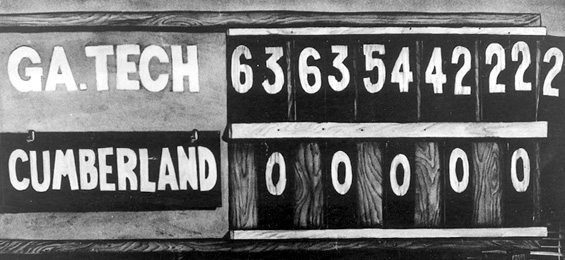
This was one of the more (in)famous instances of a college football game with a final margin of at least 60 points. Over the past 11 seasons of FBS-versus-FBS games, there have never been more than five 60-point beatdowns in a single season.
*
OVERTIME GAMES, 2003-2013
NUMBER OF OVERTIME GAMES BY YEAR
2003: 30
2004: 30
2005: 37
2006: 32
2007: 33
2008: 29
2009: 23
2010: 26
2011: 26
2012: 44
2013: 33
*
NUMBER OF TIMES THE LOSING TEAM FAILED TO SCORE IN THE DECISIVE OVERTIME STANZA
2003: 21
2004: 25
2005: 22
2006: 20
2007: 19
2008: 23
2009: 17
2010: 14
2011: 17
2012: 31
2013: 23
*
RECORDS OF TEAMS THAT HAD THE BALL SECOND IN OVERTIME
2003: 16-14
2004: 8-22
2005: 15-22
2006: 16-16
2007: 14-19
2008: 19-10
2009: 17-6
2010: 15-11
2011: 14-12
2012: 28-16
2013: 16-17
*
RECORDS OF HOME TEAMS IN OVERTIME GAMES
2003: 16-14
2004: 21-8, with 1 neutral-site game
2005: 19-18
2006: 18-14
2007: 13-19
2008: 11-18
2009: 15-8
2010: 14-12
2011: 13-13
2012: 21-20, with 3 neutral-site games
2013: 13-20
*
AVERAGE TOTAL POINTS PER OVERTIME STANZA
2003: 8.71
2004: 8.2
2005: 8.4
2006: 8.3
2007: 8.45
2008: 6.61
2009: 6.7
2010: 8.4
2011: 8.84
2012: 7.56
2013: 7.78